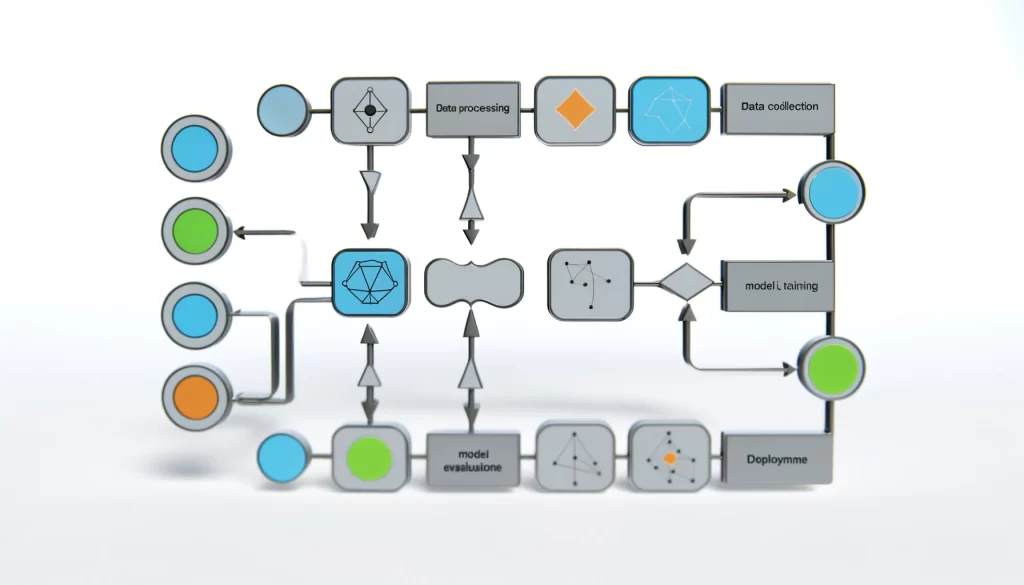
Ever felt like deciphering the intricate thought processes of a computer? Artificial intelligence (AI) can sometimes feel like a mysterious black box. But what if there was a way to visualize its decision-making process? Enter the artificial intelligence flowchart.
Table of Contents
Think of an AI flowchart as a roadmap – a clear, concise illustration of the steps an AI system takes to reach a conclusion. It’s a visual representation of the logic behind the magic, breaking down complex algorithms into easy-to-understand symbols and arrows. No more feeling lost in the labyrinth of AI! Let’s dive deeper and unveil the power of AI flowcharts.
Basics of Artificial Intelligence Flowcharts

Now that we’ve grasped the core concept of AI flowcharts, let’s dissect their anatomy. These visual roadmaps are built from a handful of key components, each playing a vital role in conveying the AI’s decision-making journey.
- Nodes: Think of nodes as the pit stops on the AI’s journey. These symbols represent specific actions, decisions, or data points encountered by the AI system. They can come in various shapes, each one signifying a distinct function. For instance, a rectangle might represent a process, while a diamond symbolizes a decision point where the AI needs to choose a path based on certain criteria.
- Edges: These are the arrows that connect the nodes, illustrating the flow of information or the sequence of actions within the AI system. Imagine them as the road itself, guiding you from one step to the next. The direction of the arrows is crucial, as they depict the logical progression of the AI’s thought process.
- Symbols: AI flowcharts utilize a universal language of symbols to represent different actions, data types, and functionalities. These symbols can be anything from basic shapes like squares and diamonds to more complex icons depicting specific operations. By understanding this symbolic language, you can readily interpret the flowchart and grasp the AI’s logic.
Imagine you’re building a recipe – the ingredients (data) are the nodes, the steps (actions) are connected by arrows, and special symbols might indicate specific cooking techniques. Similarly, AI flowcharts translate the complex recipe of an AI system into a clear and understandable format.
Designing AI Flowcharts
Craft Your Own Artificial Intelligence Roadmap
Cracking the code of AI doesn’t require a PhD in computer science. With a basic understanding of AI flowcharts, you can create your own visual representations of an AI’s thought process. Here’s a step-by-step guide to empower you:
- Define the Goal: Before diving in, clearly identify the AI system or process you want to flowchart. What specific task or decision-making sequence are you trying to visualize? Having a clear objective keeps your flowchart focused and avoids unnecessary complexity.
- Gather Your Intel: The next step is to gather information about the AI system. This might involve reviewing technical documentation, consulting with developers, or even testing the AI yourself to observe its decision points and actions. The more you understand the AI’s inner workings, the more accurate your flowchart will be.
- Start with the Big Picture: Don’t get bogged down in minute details initially. Begin by outlining the high-level steps involved in the AI process. Use basic shapes like rectangles for processes and diamonds for decision points. Focus on the overall flow of information and decision-making before adding intricate details.
- Flesh Out the Details: Once you have the skeleton of your flowchart, it’s time to add the flesh. Identify the specific data points the AI uses, the calculations it performs, and the criteria it employs for making decisions. Refine your symbols to represent these details accurately.
- Connect the Dots: Now comes the magic – connect your nodes (processes and decisions) with arrows. Remember, these arrows depict the flow of information or the sequence of actions within the AI system. Double-check the direction of your arrows to ensure they accurately reflect the AI’s logic.
- Clarity is King: Strive for a clean and uncluttered design. Avoid overloading your flowchart with excessive details, as this can defeat the purpose of visualization. Use clear labels for your nodes and arrows, ensuring anyone can readily understand the AI’s thought process.
- Test and Refine: The first draft is rarely perfect. Test your flowchart by walking someone else through it. See if they can comprehend the AI’s logic based on your visual representation. Refine your flowchart based on their feedback, ensuring clarity and accuracy.
Charting Your Course with the Right Tools
Crafting an AI flowchart doesn’t require fancy equipment or expensive software. There are a variety of tools readily available to empower you on your flowcharting journey. Here are some popular options to consider:
- Pen and Paper: Believe it or not, the classic pen-and-paper approach is still a great way to get started, especially for simple AI flowcharts. It allows for quick sketching and easy iteration without getting bogged down in software features. Just grab a pen, some paper, and standard flowchart symbols to build your initial draft.
- Free Online Tools: The internet abounds with free online flowcharting tools. These user-friendly platforms offer drag-and-drop functionality, a vast library of pre-made symbols, and basic editing features. They’re perfect for creating basic AI flowcharts without any software installation. Some popular options include Lucidchart, Draw.io, and Gliffy.
- Diagramming Software: For more complex AI flowcharts or professional presentations, consider diagramming software. These advanced tools offer a wider range of customization options, pre-built templates specifically designed for AI flowcharts, and the ability to export your creations in various formats. Examples include Microsoft Visio, OmniGraffle (Mac), and yEd Graph Editor (free).
Choosing the Right Tool
The best tool for you depends on your specific needs and the complexity of your AI flowchart. Here’s a quick tip:
- For beginners: Start with a pen and paper or a free online tool. These options are easy to learn and use, allowing you to focus on understanding the core concepts of AI flowcharts.
- For intermediate users: As your skills develop, explore diagramming software. These offer more features and customization options for creating professional-looking AI flowcharts.
Remember, the key is to choose a tool that feels comfortable and efficient for you. Don’t be afraid to experiment and find what works best to translate the complexities of AI into clear and concise visual representations.
Types of Artificial Intelligence Flowcharts
The beauty of AI flowcharts lies in their versatility. Depending on the specific AI system or process you’re visualizing, different flowchart types can be employed to best represent its decision-making logic. Here, we’ll delve into two fundamental categories:
Sequential Flowcharts
Imagine a single-lane highway – that’s the essence of a sequential flowchart. This type of flowchart depicts a linear process where the AI system follows a step-by-step approach, completing one action before moving on to the next. Each node connects to the subsequent one with a single arrow, highlighting the clear, sequential nature of the AI’s decision-making process.
Applications
Sequential flowcharts are ideal for scenarios where the AI follows a predefined set of instructions with minimal branching or decision points. For instance, a flowchart illustrating an AI spam filter’s logic would likely be sequential, showcasing how the AI analyzes an email based on specific criteria to categorize it as spam or not.
Parallel Flowcharts
Now, picture a multi-lane highway – that’s the analogy for parallel flowcharts. These flowcharts depict situations where the AI can execute multiple actions simultaneously or explore different branches based on specific conditions. Parallel flowcharts utilize multiple arrows diverging from a single decision point, showcasing the various possibilities the AI can navigate.
Applications
Parallel flowcharts are perfect for illustrating AI systems that involve complex decision-making or tackle tasks with multiple potential outcomes. For example, a flowchart representing an AI-powered self-driving car’s decision-making process might be parallel, showcasing how the car considers factors like traffic lights, pedestrians, and other vehicles simultaneously to determine the optimal course of action.
Choosing the Right Flowchart
The type of flowchart you choose depends on the inherent nature of the AI system you’re trying to visualize. Here’s a quick rule of thumb:
- Sequential flowcharts: Use these when the AI follows a clear, step-by-step process with minimal branching logic.
- Parallel flowcharts: Opt for these when the AI can explore multiple possibilities or execute actions simultaneously.
Remember, these are just two fundamental types of AI flowcharts. As the field of AI continues to evolve, so too will the variety of flowcharts used to represent its complexities.
Specialized Charts for Specific Tasks
We’ve explored the foundational types of AI flowcharts – sequential and parallel. But the world of AI is vast, and sometimes even more specialized flowcharts are needed to represent specific tasks and applications. Here, we’ll delve into two common use cases:
Predictive Analytics Flowcharts
Imagine a crystal ball for data – that’s the essence of a predictive analytics flowchart. These flowcharts visualize the steps an AI system takes to analyze historical data, identify patterns, and forecast future trends or outcomes. They typically involve a cyclical nature, with data preparation, model training, evaluation, and prediction stages all interconnected.
- Key Components: Predictive analytics flowcharts often showcase elements like data sources (databases, sensors), data pre-processing steps (cleaning, normalization), the AI model itself (decision trees, neural networks), and the final prediction or output. Arrows depict the flow of data through these stages, highlighting how the AI system learns from the past to predict the future.
- Applications: These flowcharts are invaluable in various industries. For instance, a retail store might use a predictive analytics flowchart to illustrate how their AI system analyzes customer purchase history to forecast demand and optimize inventory management.
Machine Learning Flowcharts
Think of a student diligently studying – that’s the analogy for a machine learning flowchart. These flowcharts depict the steps involved in training an AI model. They showcase how the AI system ingests data, learns from it iteratively, and refines its decision-making capabilities over time.
- Key Components: Machine learning flowcharts often include elements like data collection, feature engineering (preparing data for the model), model selection (choosing the right algorithm), the training process (feeding data to the model), and the evaluation stage (assessing the model’s performance). Arrows depict the cyclical nature of the training process, highlighting how the AI model continuously improves with more data and adjustments.
- Applications: Machine learning flowcharts are crucial for understanding how AI systems become adept at specific tasks. For example, an image recognition application might use a machine learning flowchart to illustrate how the AI system is trained on massive datasets of labeled images, allowing it to identify objects in new images with increasing accuracy.
Choosing the Right Flowchart
The specific flowchart you choose depends on the core functionality of the AI system you’re trying to represent. Here’s a quick tip:
- Predictive analytics flowcharts: Use these when the AI system analyzes data to predict future trends or outcomes.
- Machine learning flowcharts: Opt for these when the AI system learns from data and improves its performance over time.
Dos and Don’ts in AI Flowchart Design

AI flowcharts are bridges between the complexities of AI and human understanding. But just like any bridge, a poorly designed flowchart can lead to confusion and hinder communication. Here, we’ll explore some key dos and don’ts to ensure your AI flowcharts are clear, concise, and effective:
Do
- Define Your Goal: Before diving in, clearly identify the purpose of your flowchart. What specific AI system or process are you trying to visualize? A well-defined objective keeps your flowchart focused and avoids unnecessary clutter.
- Start Simple: Don’t overwhelm viewers with intricate details right away. Begin with a high-level overview using basic shapes to represent key steps and decision points. Gradually add details as needed.
- Maintain Clarity: Prioritize clarity and organization. Use clear labels for nodes and arrows, ensuring anyone can readily grasp the AI’s decision-making process. Avoid excessive text boxes – let the visuals speak for themselves.
- Standardize Symbols: Maintain consistency in your use of symbols. Adopt common flowcharting symbols (rectangles for processes, diamonds for decisions) to ensure universal understanding.
- Test and Refine: Don’t settle for the first draft. Get feedback from others, especially those unfamiliar with the AI system. Iterate based on their input to ensure your flowchart is clear and easy to follow.
Don’t
- Overcomplicate: Resist the urge to cram everything into a single flowchart. If the process is intricate, consider breaking it down into multiple, smaller flowcharts for better readability.
- Neglect Visual Hierarchy: Don’t let your flowchart become a chaotic mess of shapes and arrows. Use visual hierarchy to guide the viewer’s eye, showcasing the main flow of information with clear emphasis.
- Introduce Jargon: Avoid technical jargon or AI-specific terminology that might confuse non-technical viewers. Use clear, concise language that everyone can understand.
- Forget Aesthetics: While aesthetics aren’t everything, an attractive and well-formatted flowchart is more engaging and easier to follow. Use consistent formatting, spacing, and color-coding (sparingly) to enhance readability.
- Skimp on Context: Don’t leave viewers hanging. Briefly introduce the AI system or process being visualized at the beginning of your flowchart. This provides context and helps viewers grasp the bigger picture.
Impact of Flowcharts on Decision Making in AI
Artificial intelligence (AI) can feel like a mysterious magic trick – data goes in, decisions come out, but the process in between remains shrouded in complexity. Here’s where AI flowcharts emerge as powerful tools, shedding light on the decision-making logic behind AI systems. Let’s explore how flowcharts empower better AI decision-making:
Transparency and Explainability
AI can be a black box, but flowcharts serve as a window into its inner workings. By visually depicting the steps, data points, and decision criteria used by the AI, flowcharts promote transparency and explainability. This allows developers to identify potential biases or errors in the AI’s logic, leading to more responsible and trustworthy AI development.
Improved Communication and Collaboration
AI projects often involve collaboration between technical and non-technical stakeholders. Flowcharts bridge this communication gap by offering a clear, concise visual representation of the AI’s decision-making process. This fosters better understanding, facilitates discussions, and ensures everyone involved is on the same page.
Enhanced Debugging and Troubleshooting
When an AI system produces unexpected outputs, flowcharts become invaluable debugging tools. By tracing the AI’s steps through the flowchart, developers can pinpoint where issues might arise and identify the root cause of errors. This allows for faster and more efficient troubleshooting, ensuring the AI system functions as intended.
Facilitating Human Oversight and Control
As AI becomes more sophisticated, the need for human oversight remains crucial. Flowcharts empower humans to understand the rationale behind the AI’s decisions. This enables them to set appropriate guardrails, intervene when necessary, and ensure the AI operates within ethical and regulatory boundaries.
A Real-World Example:
Imagine an AI system used for loan approvals. An AI flowchart could illustrate the various factors the AI considers, such as income, credit score, and debt-to-income ratio. This transparency allows human loan officers to understand the AI’s decision-making process and intervene if they believe certain mitigating factors were not adequately considered.
The Future of Flowcharts and AI
As AI continues to evolve, flowcharts will likely adapt alongside it. We might see the emergence of more specialized flowcharts designed for specific AI applications. Additionally, advancements in automated flowchart generation could streamline the process of creating these visual roadmaps.
In conclusion, Artificial intelligence might seem like a labyrinth of ones and zeros, but AI flowcharts offer a valuable roadmap to navigate its complexities. By harnessing the power of visual representation, these flowcharts empower clear communication, promote transparency in AI decision-making, and ultimately pave the way for the responsible and ethical development of AI. So, the next time you encounter an AI system, remember the power of the flowchart – a tool to unlock the mysteries of artificial intelligence and illuminate the path towards a future where humans and AI can work together in harmony.
Also Read: Red Artificial Intelligence: Exploring the Power, Potential Perils, and Exciting Future

